Chaos in the network — using ToxiProxy for network chaos engineering

Chaos engineering is the discipline of experimenting on a software system in production to build confidence in the system’s capability to withstand turbulent and unexpected conditions.
If you are new to Chaos Engineering, go through this introduction first:
Engineering Chaos: A Gentle Introduction
In production outages, a lot of blame is attributed to the network — sometimes with reason and evidence but countless other times because there is no other visible culprit to blame.
To increase the resilience against network failures and degradation, we need to run our chaos experiments on the network. But this is not always easy — if your application is in a data center, the chances of getting your hands on the network infrastructure to introduce chaos are close to zero, and with good reason. If the application is hosted in the cloud, the network layer is mostly abstracted out from you.
What in this situation would be the right way to introduce some network chaos? Given we can't manipulate the networking infrastructure itself, the next best thing we can do is redirect the traffic to a system that we can control and then forward the traffic to the original destination. This can be achieved in different ways — manipulating routing, modifying DNS records, using forward proxies, and transparently intercepting network packets using tools like iptables or EBPF.
In this article, we are going to examine one such tool — Toxiproxy. It is a framework and TCP proxy that can simulate poor network conditions. It was developed by Shopify to test the resilience of its webstack. Toxiproxy is a network proxy that can intercept and forward TCP communication. It is highly performant and easy to configure. For any traffic flow that needs to be intercepted and tested for network degradation, that traffic can be sent through Toxiproxy and subjected to various experiments before being sent to its intended destination.
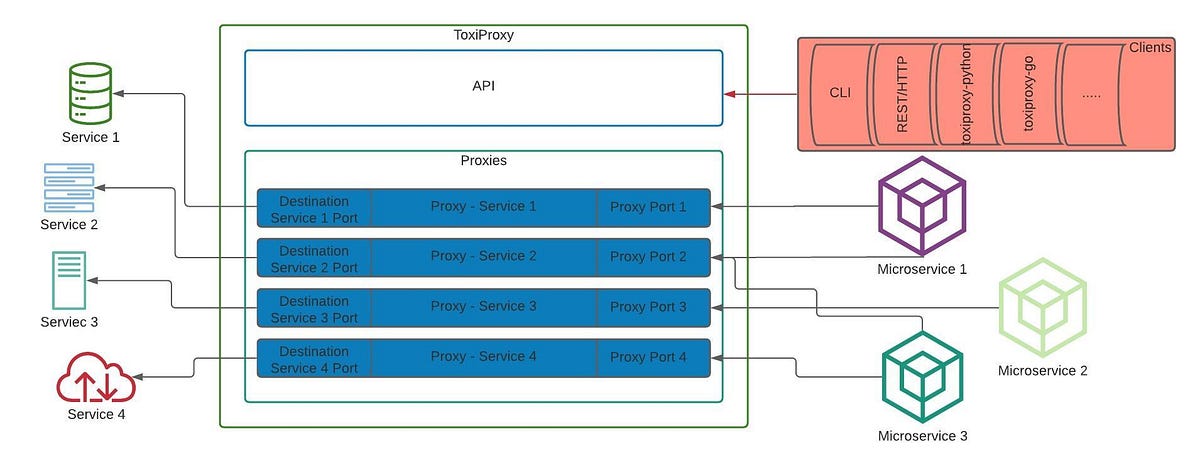
Toxiproxy has two components:
The control plane — the API used to manage the proxy configuration. The control plane can be managed by directly hitting the API/the toxiproxy-cli / various client libraries
The data plane — the proxies that are created on demand to proxy different services
The Toxiproxy ecosystem is as given below
OK, so we have installed and started toxiproxy, but how exactly does it simulate poor network conditions, and what are those conditions?
To proxy the traffic to any given downstream service, a corresponding proxy has to be created within toxiproxy with a source port of our choosing ( through which we will proxy to the destination ) and the port of the specific downstream/destination service.
For example, when you want to proxy traffic to a remote MySQL server running on default port 3306, you create a proxy with a source port of your choice ( say 4306 ) and destination port and host as :3306. Now your application will configure its MySQL client to talk to :4306.
Once the proxy is ready, it's time to introduce the fault (anomaly/poor condition). In toxiproxy, these conditions are called toxics ( hence the name toxiproxy ). These toxics have their own parameters/attributes.
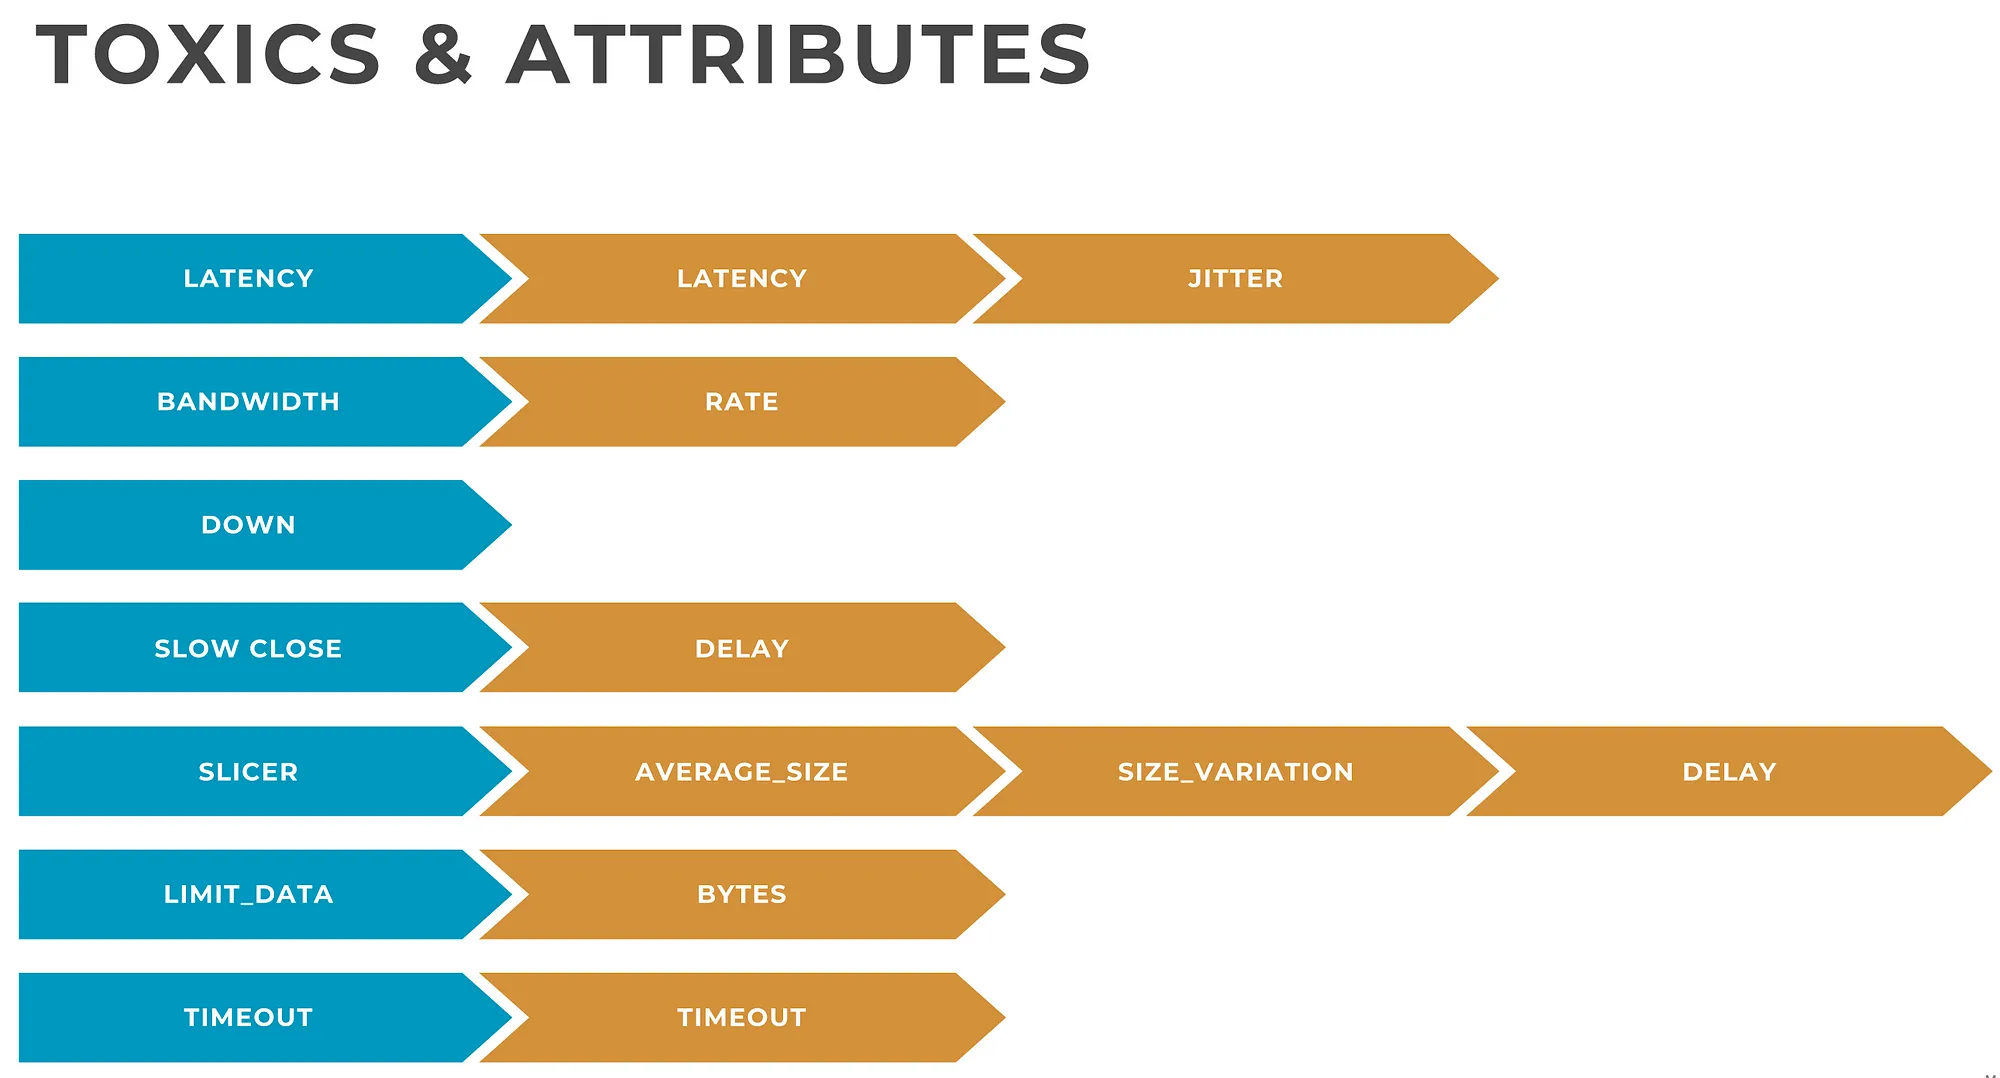
While the toxics and the attributes are mostly self-explanatory, more details about toxics and attributes can be found here
Setting up and testing a proxy
Toxiproxy installation is quite easy ( it is a single binary each for the server and the CLI ). Instructions can be found here. Once the proxy is installed, run it on the default port — 8474 ( or an alternate port of your choosing — in which case you should use “— host” option with the cli ). This is the port on which the control plane API would be available.
Once the installation is done, we can start setting up proxies.
First start toxiproxy by running the server binary: toxiproxy-server . Binary can be run without any arguments to run it on interface 127.0.0.1 port 8474. Toxiproxy keeps all modifications in memory, but a config file in JSON format with predefined proxies and toxics can be provided as a command-line argument. Once the proxy is started it can be manipulated using the toxiproxy-cli binary or the client libraries in different languages. The process is outlined below.
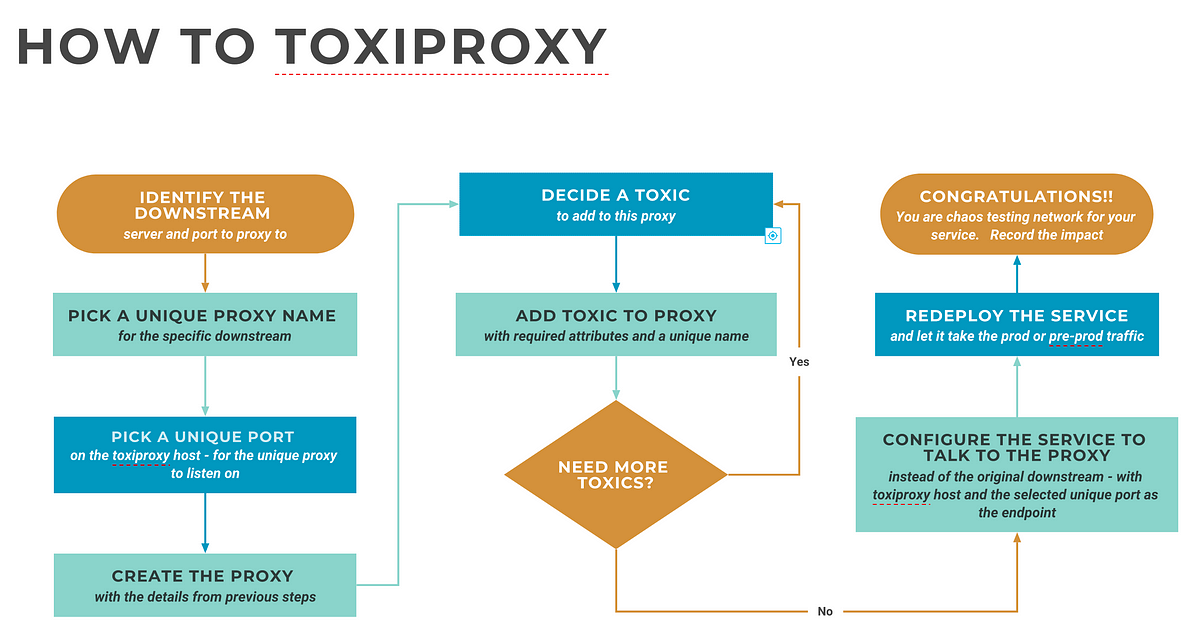
Now let us try a practical example
toxiproxy is running on the default port on my laptop
the downstream we will proxy to is the Geo-location API of ipify.org. Specifically, the endpoint https://geo.ipify.org/api/v1 which returns the public IP and Geolocation of the caller
Let's configure the proxy with
— Unique proxy name: ipify
— Downstream server: geo.ipify.org
— Downstream port: 443 ( SSL )
— Proxy port: 8443
Toxic to inject
— type: latency
— attribute: latency
— value: 1500 ( milliseconds )
— name: latency_1500
Let us create the proxy using the toxiproxy-cli
toxiproxy-cli create ipify --listen localhost:8443 --upstream geo.ipify.org:443
Add toxic
toxiproxy-cli toxic add --toxicName latency_1500 -type latency --attribute latency=1500 ipify
Let's list the proxies and then inspect the ipify proxy
toxiproxy-cli list
Name Listen Upstream Enabled Toxics
\====================================================================
ipify 127.0.0.1:8443 geo.ipify.org:443 enabled 1
toxiproxy-cli inspect ipify
Name: ipify Listen: 127.0.0.1:8443 Upstream: geo.ipify.org:443
\====================================================================
Upstream toxics:
Proxy has no Upstream toxics enabled.
Downstream toxics:
latency_1500: type=latency stream=downstream toxicity=1.00 attributes=[ jitter=0 latency=1500 ]
Let’s hit the geo.ipify.org API directly and get my public ip and Geo location using curl. We will also print the total time taken for the request. We will filter the JSON output using jq to only pick up the country of the public IP. Please note that I have saved my API key to the shell variable IPIFY_APIKEY already.
curl -s -w "%{stderr}Total Time: %{time_total}\nCountry from public IP: " "https://geo.ipify.org/api/v1?apiKey=${IPIFY_APIKEY}" |jq .location.country
Total Time: 4.108721
Country from public IP: "IN"
The vanilla request without any proxy took approx 4100 milliseconds / 4 seconds
Now let us send the traffic via the proxy we created earlier. Not that we need to pass the host header and disable SSL checking.
curl -k -s -w "%{stderr}Total Time: %{time_total}\nCountry from public IP: " -H "Host: geo.ipify.org" "https://localhost:8443/api/v1?apiKey=${IPIFY_APIKEY}" |jq .location.country
Total Time: 5.727683
Country from public IP: "IN"
As you can see, the request now took 5700 milliseconds with the addition of roughly 1500 milliseconds. You can experiment with various toxics like this to chaos test your app against network conditions.
Note: The ipify API response time greatly varies when it is under load ( and am using a free version of their API ). Try to experiment withe either a performant public API or an internally hosted service for consistent results.
