Engineering Chaos: A gentle introduction

With the wide adoption of microservice architecture, it has become increasingly complex to predict and protect against production outages arising from infrastructure and application failures. Oftentimes, underlying reliability and performance issues are brought out by these outages. The engineers maintaining these applications and infrastructures often speculate about common issues that could occur and try to proactively fix them based on their speculation. While this works to a point, the shortcoming is that the speculation often fails to level up with the real impact as it occurs in production.
So how do we better prepare for such issues? Making fixes based on the speculation and waiting for an outage to occur to confirm our hypothesis is neither scalable nor practical. We need to attack this problem head-on. That is where chaos engineering comes into the picture.
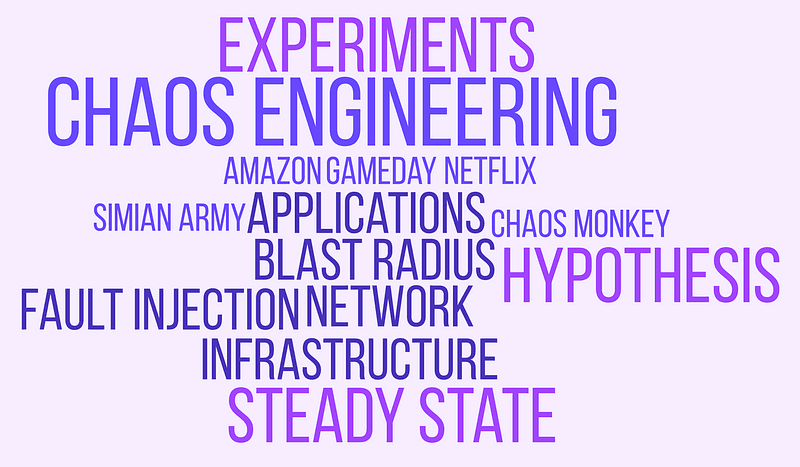
Chaos engineering is the discipline of experimenting on a software system in production to build confidence in the system’s capability to withstand turbulent and unexpected conditions
In other words, chaos engineering looks for evidence of weakness in a production system.
The Evolution of Chaos Engineering
The term chaos engineering rose into popularity shortly after Netflix published a blog in 2010 about their journey in migrating their infrastructure into the AWS cloud. In the article, they talked about the tool Chaos Monkey, which they used to randomly kill EC2 instances. This was to simulate production outage-like scenarios and observe how their infra copped with such failures. This trend of experimenting by introducing failures into the production infrastructure quickly caught on and companies started adopting the principles and soon chaos engineering evolved into its own discipline.
While Netflix might have popularized chaos engineering, breaking infrastructure to test the resiliency has its roots in Amazon, where Jesse Robins, popularly known in Amazon as the Master of Disaster introduced Gamedays. Gameday is a program where failures are introduced into production to observe how systems and people respond to them and based on the observation the systems are fixed/rebuilt/re-architected and processes improved. This greatly helped Amazon in exposing weaknesses in its infrastructure and fixing them.
Chaos Experiments
Practical chaos engineering at its heart is the process of defining, conducting, and learning from chaos experiments.
Before we start with experiments, we need to identify a target system for which we will test the resilience. This system could be an infrastructure component or an application. Once you identify such a target, map out its dependencies/downstream — databases, external APIs, hardware, cloud/data center infrastructure, etc. The aim is to identify the impact on the target — if any — when an anomaly/fault is injected into one of its dependencies.
Once we have decided on the target and the dependency to which fault should be injected — define a steady-state for this system. A steady state of a system is the desirable state in which the target can serve its purpose optimally.
Following this, form a hypothesis about the resilience of the system. The hypothesis defines the impact that the target would suffer when the fault is injected into the dependency, causing the target to violate its steady state. As part of this, the nature and severity of fault to be injected — the real-world failure scenario that needs to be simulated — should be defined as well.
After we decide on these factors, the fault injection can begin. In an ideal world, the fault should be injected into the production system, though it doesn’t hurt to first try this out in a pre-production environment. In a reasonably well-built system, the target will withstand the fault for a while, then start failing when it crosses some threshold or as the impact of the fault aggravates. If the impact of the fault is not severe, or the target is designed to withstand the fault, the experiment and the severity of the fault need to be redefined. In either case, the experiment should define a stop condition — this is the point when an experiment is stopped — either after encountering an error/breakage in the target system or after a defined period without encountering any errors/violation to the steady state.
During the experiment, record the behavior of the target system — what was the pattern of the standard metrics, what events and logs it generated, etc. It is also important to watch upstream services that make use of the target service. If the experiment was stopped after encountering an error this would provide valuable insight into the resiliency and should be used to improve the resilience of the target system as well as upstream services.
If the target didn’t encounter any errors and the experiment finished without incidents after the defined time, the fault and its impact need to be redefined. This would entail defining more aggressive faults which would result in increased impact on the target system. This process is known as increasing the blast radius.
Rinse and repeat the process until all weaknesses are eliminated.

An example to tie it all together
Consider your company is into fleet management and last-mile delivery. There are several micro-services in your application infrastructure. There would be front-end and back-end services that handle inventory, vehicles, drivers, shifts, route planning, etc.
Note: this is a very trimmed down and hypothetical design and may not cover all possibilities
Let’s follow the process outlined in the previous section.
Selection of target service — route planning microservice.
The route planner uses Google Maps API, an in-memory cache like Redis, and a MySQL back-end among other things. Route planner exposes a REST API that is used by the upstream front-end services that display the optimal route the drivers should take.
Downstream dependency service — we pick Google Maps API as the service to which fault should be injected.
The steady-state: when operating in the optimal condition, the route planner will serve 99% of the requests under 100ms latency ( P99 latency ). Service can tolerate P99 latency upto 200ms
Fault and severity — A latency of 50ms when accessing the Google Maps API — for each API call
Hypothesis: Upstream front-end servers have a timeout of 200ms for getting a response from the route planner API. Even after accounting for a 50ms latency to Google Maps API, the route planner will still return a result within 150ms which is well within the expectation of the upstreams. Expect the P99 latency to be at 150ms and no significant increase in 4xx or 5xx errors for the route planner. Don’t expect the upstream services using this API to have any issues.
Stop condition:
— 10 minutes run without any impacts
— P99 latency crosses 200ms
— Increase in 5xx errors — 2% of total requests
— Failure reports from upstream services or customers
Experiment start and fault injection: In practice, this could be achieved in many ways, one popular option being the use of an intermediary proxy to control the latency of the outgoing traffic. For eg: Toxiproxy can be configured to sent outbound traffic with a latency of 50ms ( and proxy the traffic to google maps API ). For this to work, the route planner application should be redeployed with the Toxiproxy endpoint in the place of the Google Maps API URL. If you are on Kubernetes you can also use Chaosmesh for introducing chaos.
Record fault injection and its impact
Scenario 1: No issues, P99 latency was close to but less than 150ms. No visible change in the number of 5xx/4xx errors
— Stop the experiment. Increase the blast radius by raising the latency from 50ms to 75ms. Repeat the experiment
Scenario 2: P99 latency is between 150ms and 200ms, 5xx errors for the front end spike to 3%. Users report seeing blank pages instead of route plans.
— Stop the experiment, and investigate the issue.
— You find that for certain routes 3 Google Maps API calls were needed instead of 1. The route planner returned the right result within 250ms ( 100 + 50 * 3 ) but the API request from the front-end server requesting the route data has already timed out at 200ms. This causes front-end servers to show a blank page instead of a meaningful message. Since only a small percentage of requests had this issue, their 200+ ms latency was averaged out with a large number of 150 ms requests.
— Fix the code, and see if the 3 calls can be run in parallel instead of sequential. Modify the front-end code to gracefully handle timeout and show a customer-friendly message.
Once the issues are fixed, repeat the experiments.
Best practices and checklists
If there are single-point-of-failures / other resiliency issues in the infrastructure/application that are already known fix them before attempting to run chaos experiments in the production
Make sure all the vital metrics for the target and dependent systems are being monitored. A robust monitoring system is essential for running chaos experiments
While it is natural to focus primarily on the target service and the downstream dependency, it is vital to monitor the upstream services and the customers of the target service
Use learning from previous outages and postmortems to create a better hypothesis as well as fix known problems proactively
Use the learning from chaos experiments not only to fix software systems but also to fix any gaps in the process — oncall response, runbooks, etc.
Once you are confident about the experiments, automate them fully and let them run periodically in production.
To build confidence to test in production, chaos experiments can be incorporated into the testing process for pre-production build pipelines


